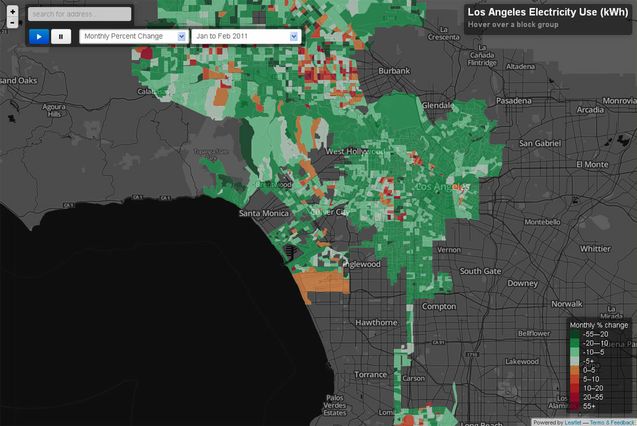
The first highly interactive map of Los Angeles' electricity use
A new map by UCLA’s California Center for Sustainable Communities is the most highly interactive map of Los Angeles’ energy use ever developed. Above, a color-coded look at how energy use increases and decreases month-to-month.